ICML 2026

Conformal Reliability: A New Evaluation Metric for Conditional Generation

Evaluating not only how good a generated output is, but how bad likely outputs can be.

Yachen Gao1,2, Xinwei Sun3, Yikai Wang4, Ye Shi5, Jingya Wang5, Jianfeng Feng1,3, Yanwei Fu2,3
1Institute of Science and Technology for Brain-Inspired Intelligence, Fudan University 2Shanghai Innovation Institute 3School of Data Science, Fudan University 4Nanyang Technological University 5ShanghaiTech University
Corresponding authors: Xinwei Sun, Yanwei Fu
CReL pipeline for calibrated prediction sets and worst-case reliability optimization.
CReL maps generated outputs into latent space, calibrates a prediction set, and optimizes the worst-case reliability score.

Abstract

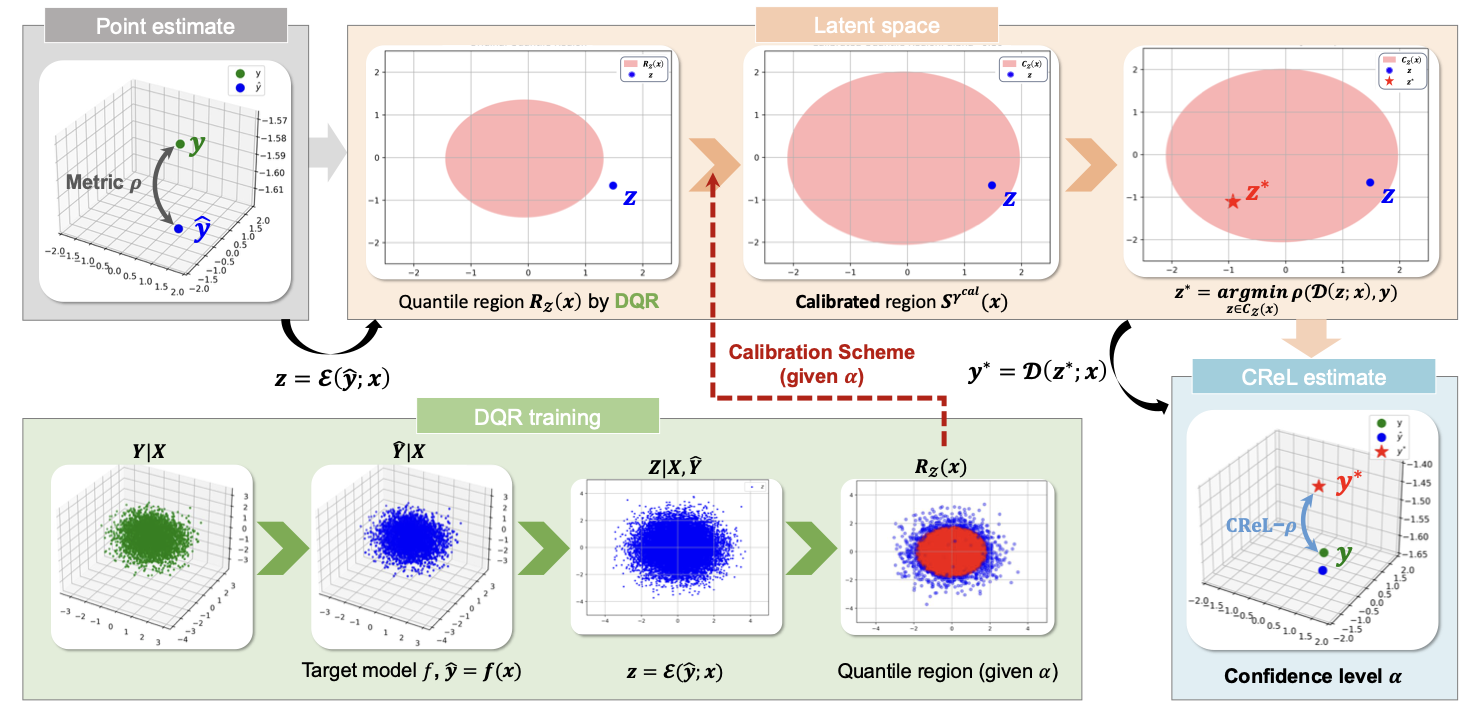
Conditional generative models have recently achieved remarkable success in various applications. However, a suitable metric for evaluating the reliability of these models, which takes into account their inherent uncertainty, is still lacking. Existing metrics, which typically assess a single output, may fail to capture the variability or potential risks in generation. In this paper, we propose a novel evaluation metric called reliability score based on conformal prediction, which measures the worst-case performance within the prediction set at a pre-specified confidence level. However, computing this score is challenging due to the high-dimensional nature of the output space and the nonconvexity of both the metric function and the prediction set. 
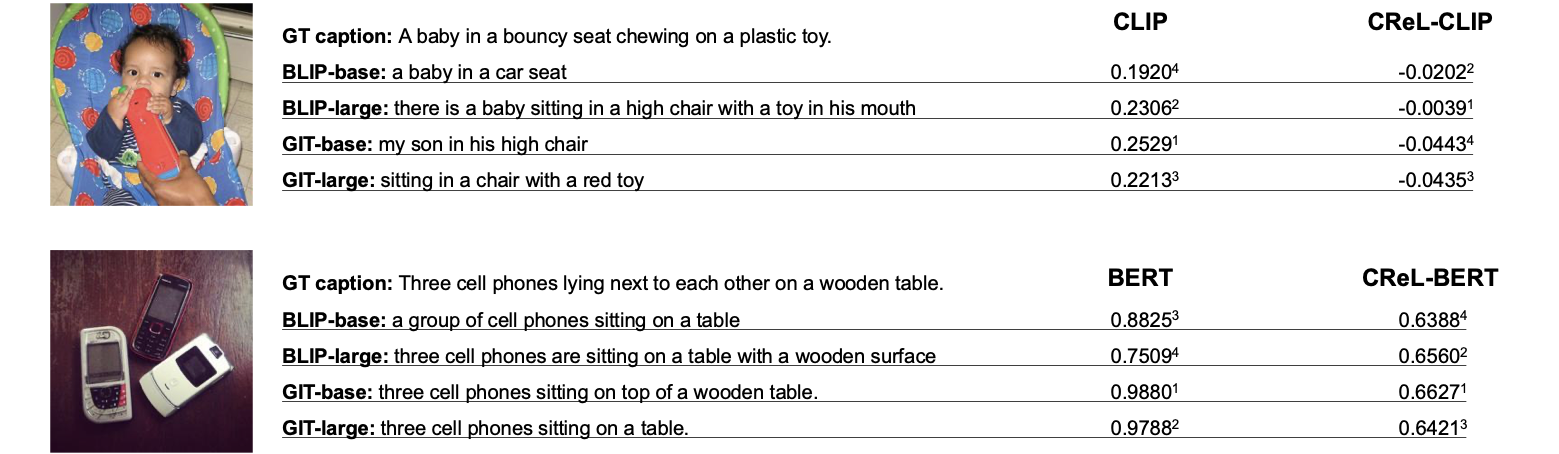
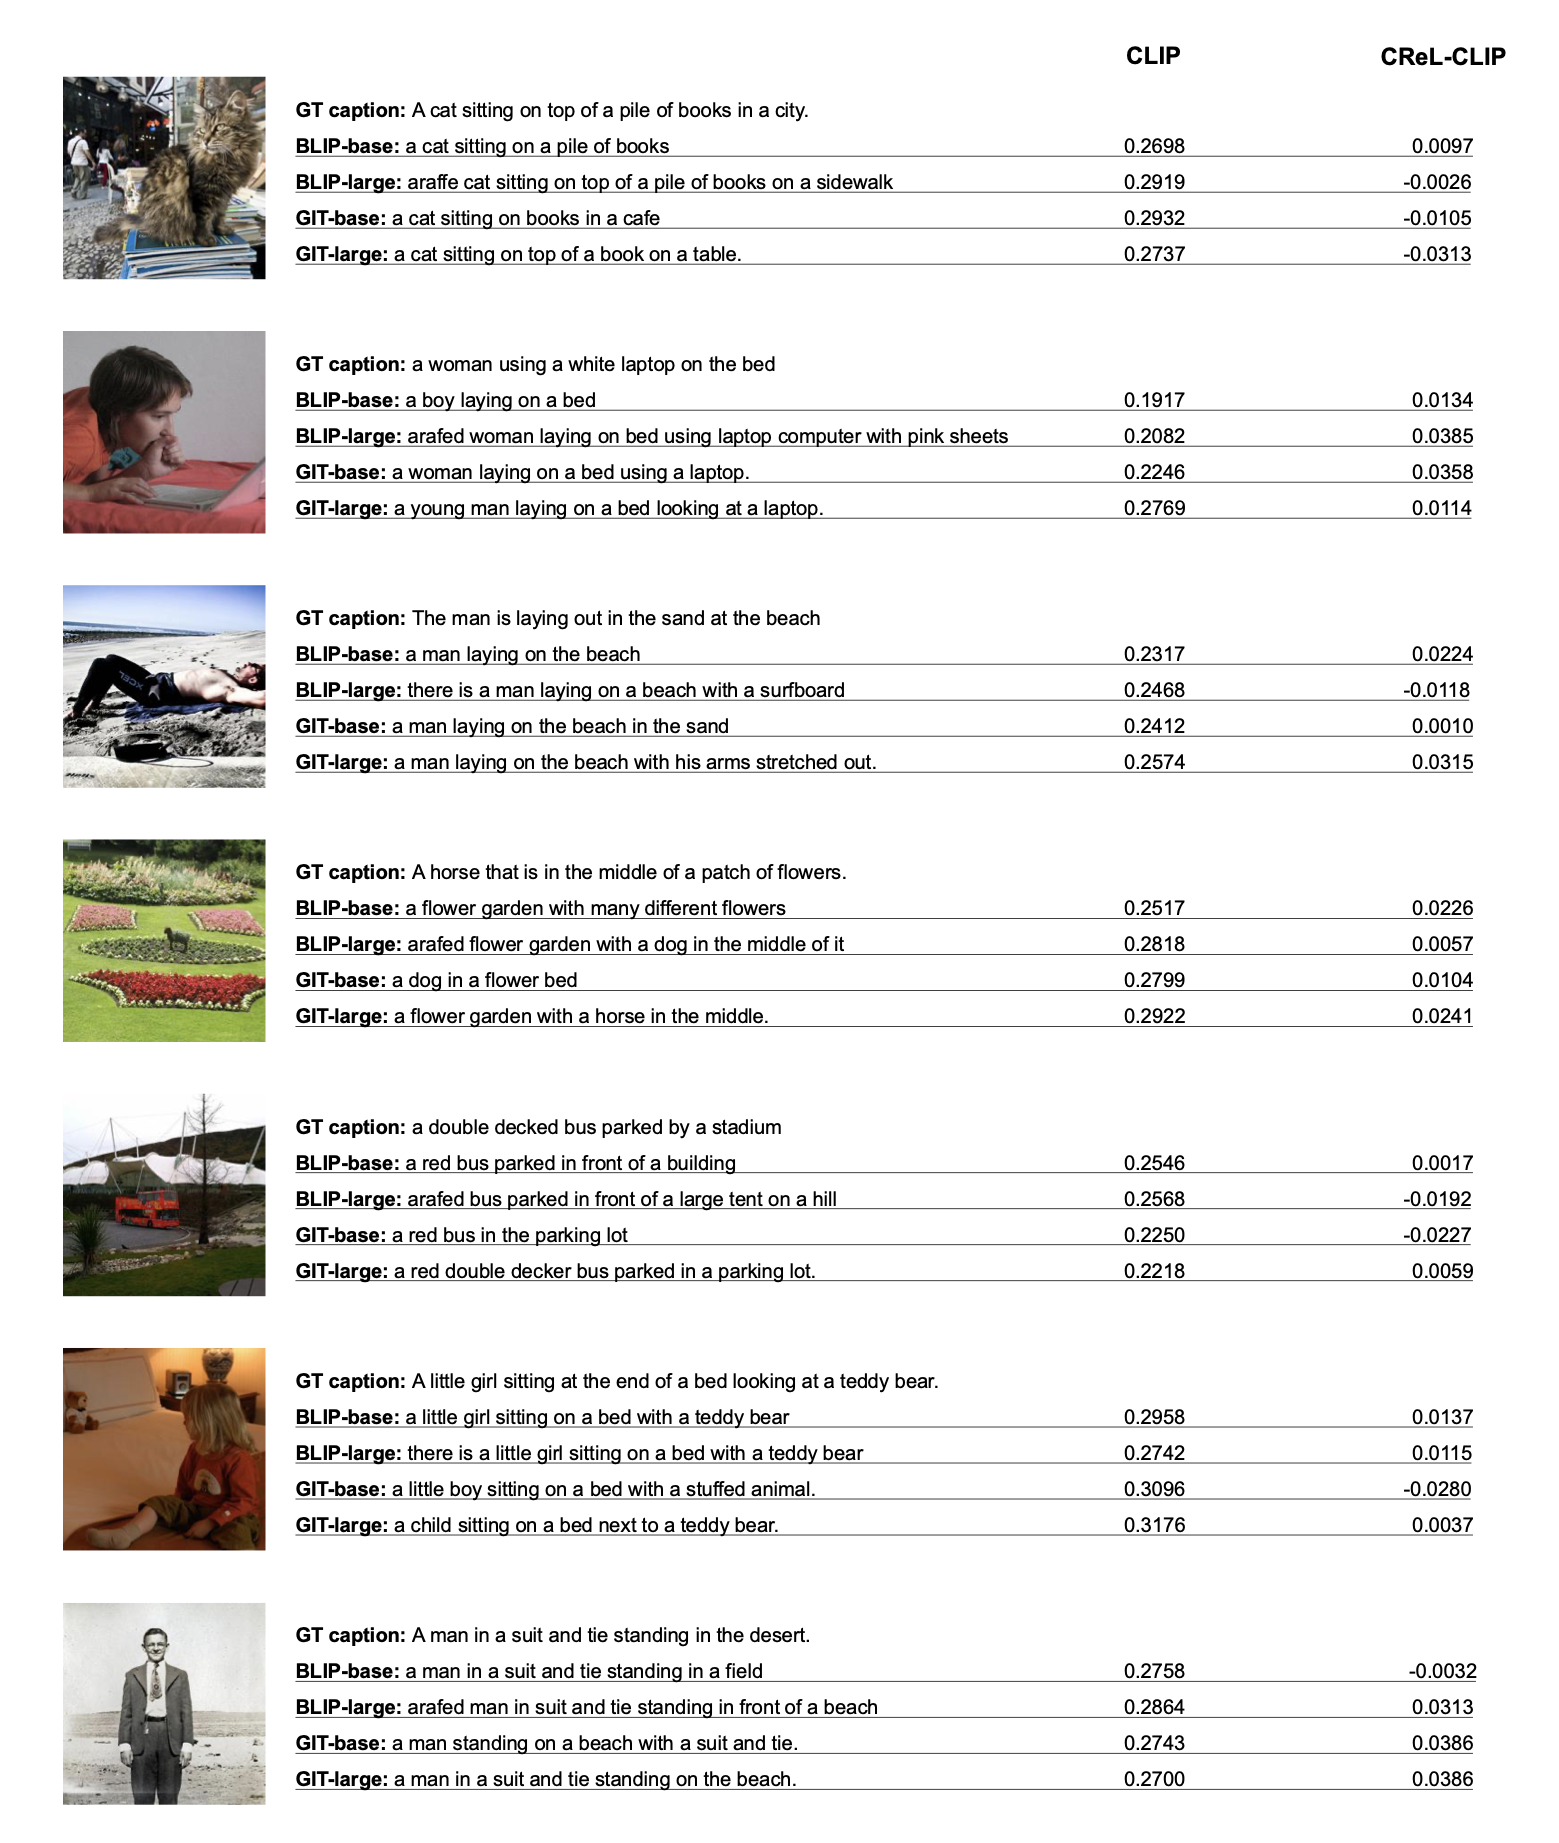
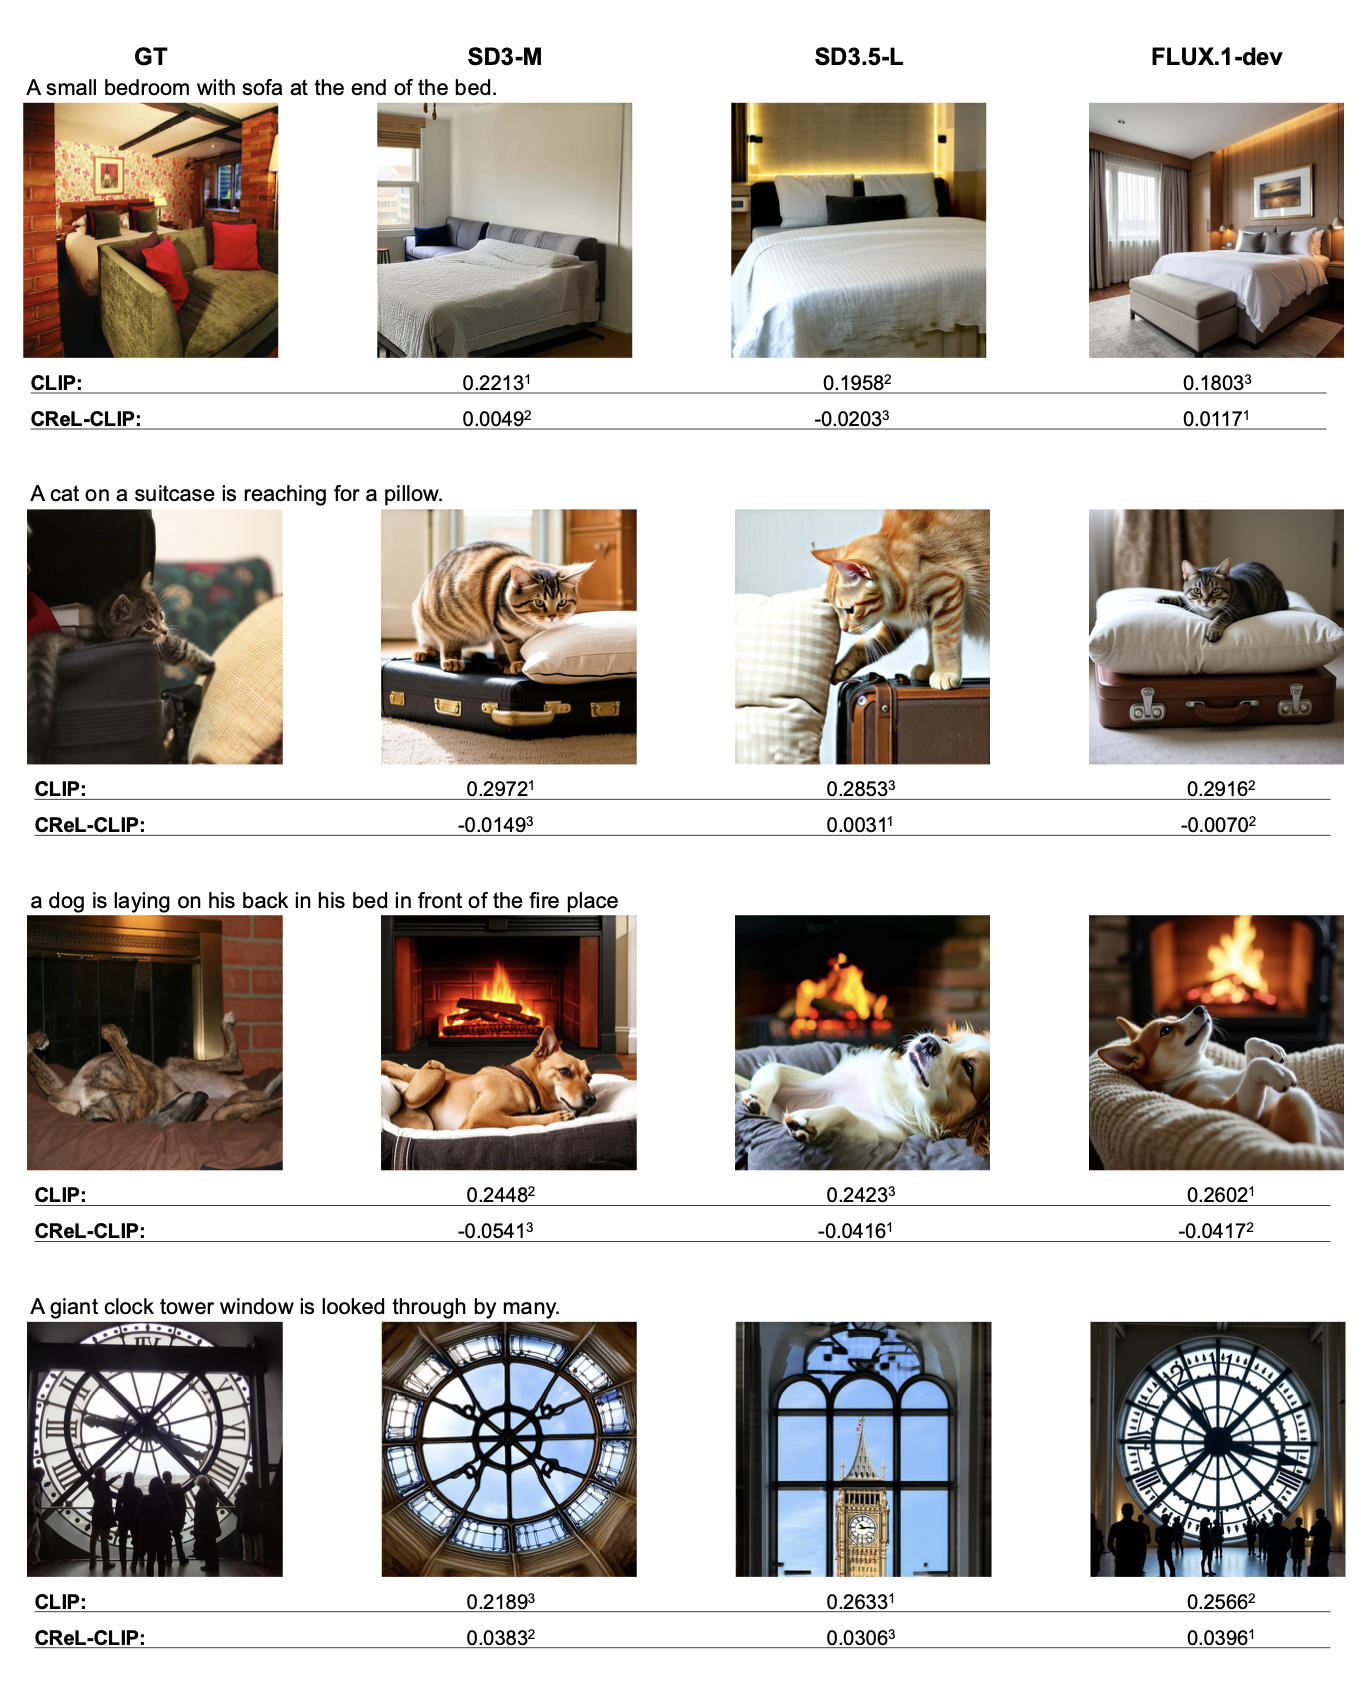
To efficiently compute this score, we introduce Conformal ReLiability (CReL), a framework that can (i) construct the prediction set with desired coverage; and (ii) accurately optimize the reliability score within the constructed prediction set. We provide theoretical results on coverage and demonstrate empirically that our method produces more informative prediction sets than existing approaches. Experiments on synthetic data and the image-to-text and text-to-image tasks further demonstrate the interpretability of our new metric, and the validity and effectiveness of our computational framework.

Motivation

Average metrics can miss risky plausible outputs.

Metrics such as CLIP-SIM, BERT-SIM, and DINO-SIM are useful for measuring generated outputs, but single-output or average-case evaluation can hide failures in the lower-performance region of a model's output distribution. A model may look strong on average while still producing plausible samples with harmful hallucinations, missing semantics, or weak structural fidelity. CReL asks a reliability-centered question: among outputs that remain statistically plausible, how bad can performance become?

Method

CReL builds a calibrated set of likely outputs and optimizes the worst-case score.

CReL projects high-dimensional generated outputs into a structured latent space using a latent generative model. Directional quantile regression constructs a latent quantile region, conformal calibration expands it to satisfy the target coverage level, and the decoded prediction set represents likely model outputs. The final CReL-ρ score is computed by optimizing a user-chosen similarity metric inside this calibrated set, using projected gradient descent over convex latent-space constraints.

Results

Coverage

Synthetic Coverage

On nonlinear synthetic data, CReL reaches target coverage with more informative regions than DQR and Feldman.

α Coverage Area in Y
Ours-Z Ours-Y Feldman-Y DQR-Z DQR-Y Ours Feldman DQR
0.02 0.9770 0.9760 0.9718 0.9818 0.9872 398.5 377.8 749.1
0.10 0.8953 0.8915 0.8940 0.8823 0.9145 232.7 234.5 287.4

real world

Image-to-Text

MS-COCO 2014, BLIP/GIT models, evaluated by CLIP-SIM and BERT-SIM at α = 0.1.

Model CLIP-SIM BERT-SIM
CLIP CReL-CLIP BERT CReL-BERT
BLIP-base 0.2330 (r4) 0.0070 (r1) 0.8349 (r3) 0.6335 (r3)
BLIP-large 0.2453 (r3) -0.0074 (r4) 0.8106 (r4) 0.5631 (r4)
GIT-base 0.2511 (r2) -0.0021 (r2) 0.8620 (r2) 0.6474 (r1)
GIT-large 0.2550 (r1) -0.0043 (r3) 0.8649 (r1) 0.6459 (r2)

real world

Text-to-Image

MS-COCO 2014, SD3/FLUX/Kandinsky models, evaluated by CLIP-SIM and DINO-SIM at α = 0.1.

Model CLIP-SIM DINO-SIM
CLIP CReL-CLIP DINO CReL-DINO
SD3-M 0.2590 (r3) 0.0134 (r1) 0.4615 (r1) -0.1480 (r4)
SD3.5-L 0.2596 (r2) 0.0116 (r2) 0.4531 (r2) -0.1365 (r1)
FLUX.1-dev 0.2509 (r4) 0.0056 (r4) 0.4395 (r4) -0.1411 (r3)
Kandinsky-2.2 0.2603 (r1) 0.0062 (r3) 0.4407 (r3) -0.1404 (r2)

Qualitative Examples

CReL catches semantic and visual misalignments missed by CLIP, BERT, and DINO-style single-score evaluations.

Image-to-text examples show cases where CReL better reflects caption reliability than uncalibrated CLIP-SIM or BERT-SIM.
Qualitative examples for text-to-image models evaluated by CReL.
Text-to-image examples show that CReL can penalize hallucinations, missing spatial relations, and weak structural matches.

BibTeX

TODO